How do we build analytics system in Scentbird
Couple of months ago Scentbird has celebrated 2 years of building internal analytics system. I considered it is a time to start sharing our experience with the community and it was a topic of my HighLoad 2019 (the biggest conference in Russia regarding high load systems) speech. Here it is (in Russian):
However, I suppose it is worth to re-tell the story in English. So I will try to do it below. In the beginning, I'd like to say that it is not about best practice (we are building our first analytics system), so it is just our experience with all set of mistakes and issues. I hope it will help others to avoid the same traps.
What do we begin with? It was quite a simple setup:
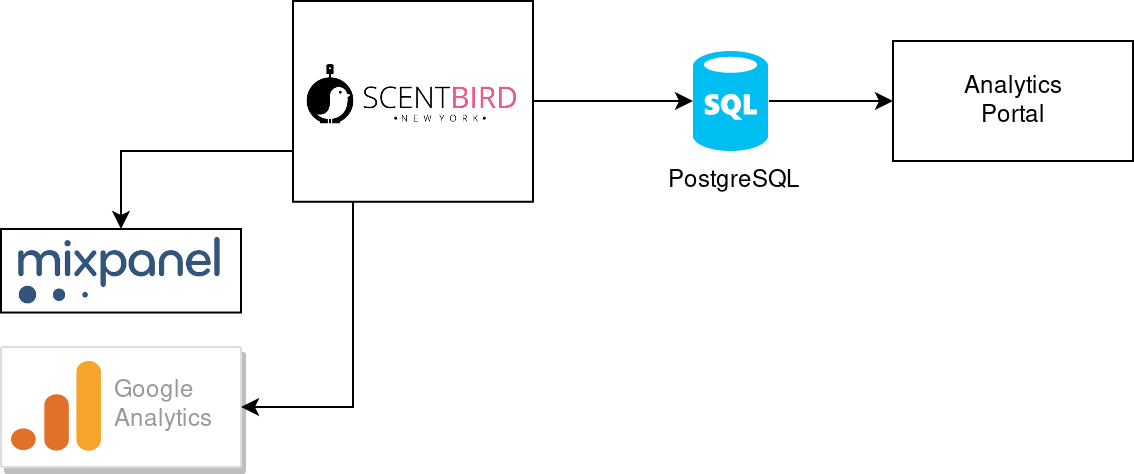
We get a self-made analytics portal at the beginning. It was connected directly to the same database (website database) our main web service was. Web analytics was done by external systems like Mixpanel and Google Analytics. It was quite simple to build, but sometimes heavy analytics SQLs affected the performance of the main website. It was easy to resolve it: introduce read-only replica for the database (Postgres supports such replica out of the box):
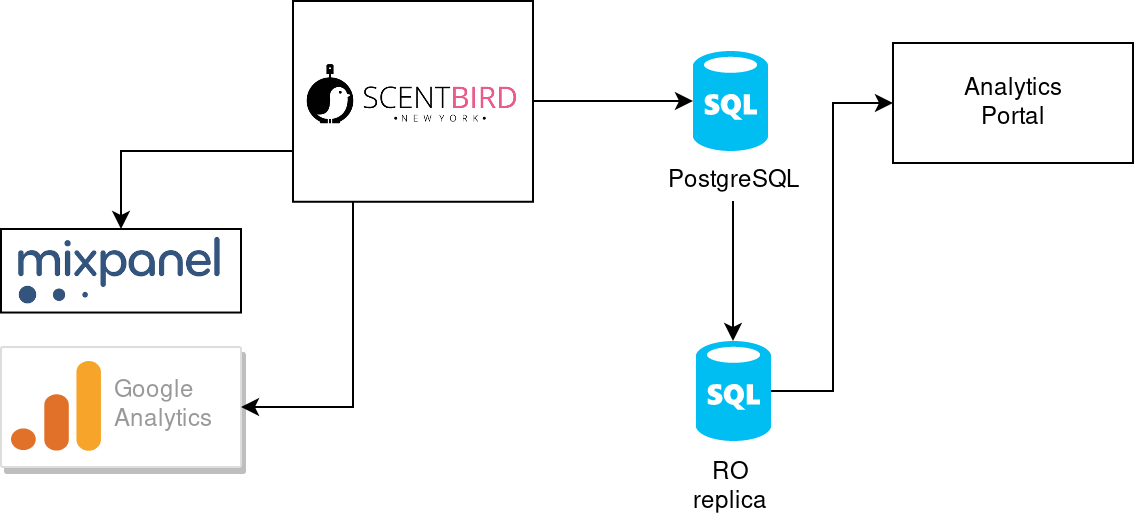
The new setup helps us to avoid performance issues caused by analytics SQLs at the side on the website. However, analytics SQLs was performed with a bad performance even with the dedicated read-only replica. It became clear: we need another way to store our analytics data. That is how do we find out Redshift database in Amazone ecosystem. In short, it has such advantages for us:
- Amazon ecosystem (we are using AWS services a lot);
- column-based DB;
- PostgreSQL-based: quite easy to reuse initial SQL;
- simple performance tests promise ~10x faster query execution;
Looks great, but data should be somehow transferred from website database to newly created analytics-specific Redshift database. That is how we discover what does ETL (extract, transfrom, load) means. We have checked several ETL solutions: AWS DataPipeline, Stitch, AWS Glue. AWS Glue was a winner at the end, so we introduced it in our stack with Redshift:
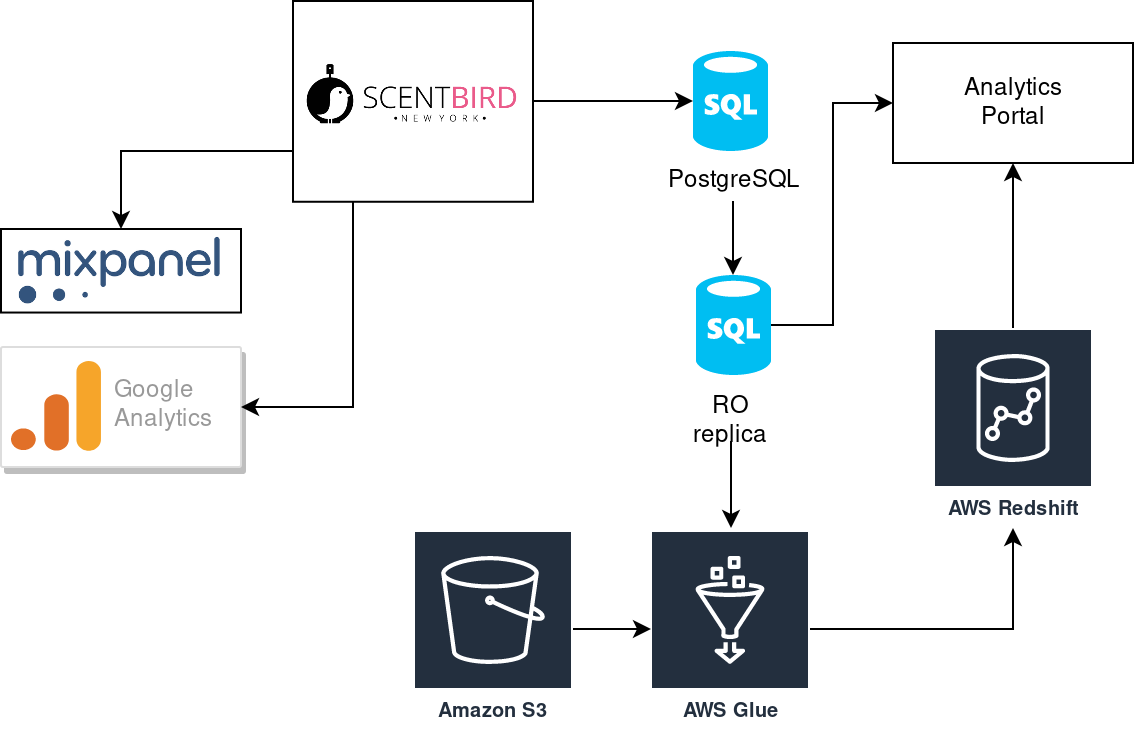
We increased the complexity of our stack, but it gave us a great speed boost. We were able to move further with more complex analytics and do not afraid about the performance of analytics reports. Users like the performance and started asking for more new reports. As you remember, we were using our analytics portal with developing all UI stuff. Additional reports lead us to a new amount of UI components that should be developed and maintained. Dev team spent more and more time for UI, instead of working with data. It was a moment of taking a look at BI-tools. Once again we compare several options: Metabase, Tableau, AWS QuickSight, Looker. We decided to jump into Looker, still using it and happy:
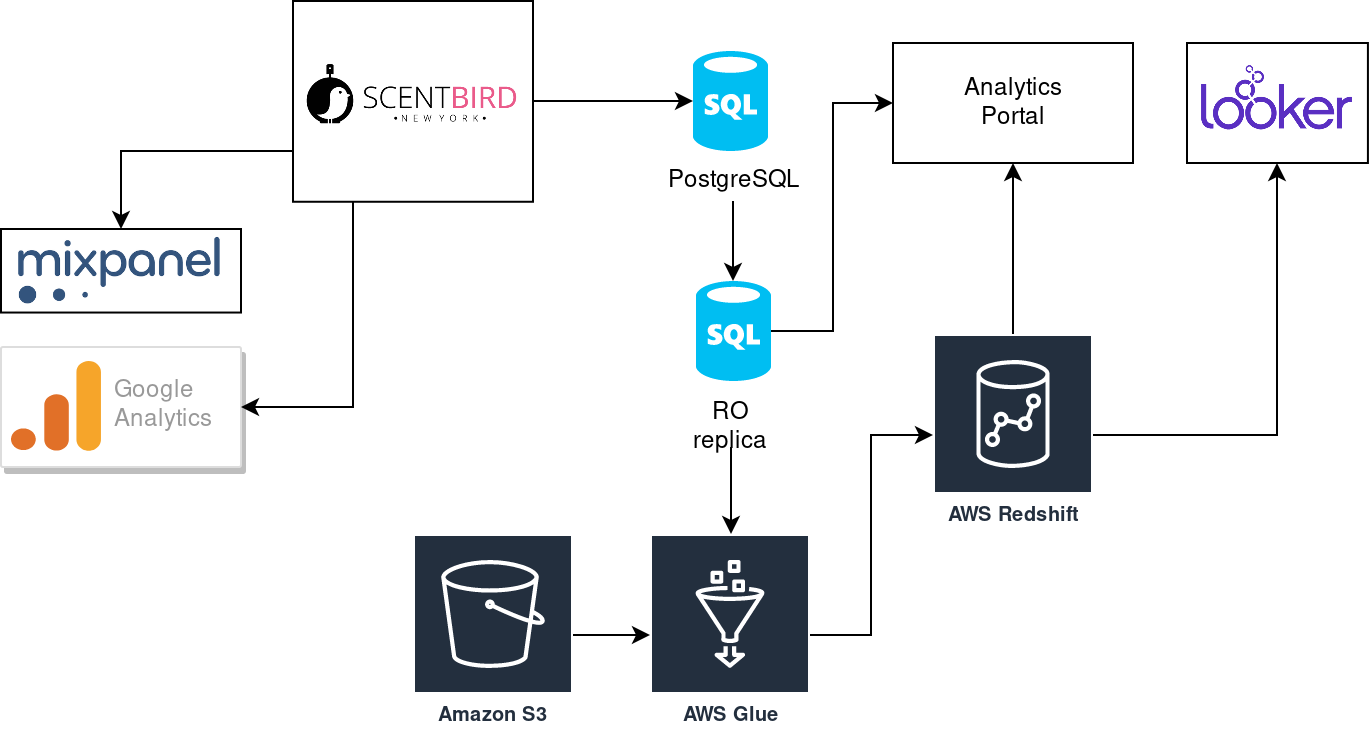
It gave the dev team an ability to concentrate on data tasks instead of building UI. It is possible to resolve about 80% of users' requests without any development (it can be some assist from dev side, but no development of UI anymore). We are using our old self-made analytics portal still but perform some migration of its reports to Looker.
Having good performance and be able to concentrate on data development only, We had opened a new level of complexity in our analytics. We were trying to build long transformation pipelines with AWS Glue (it has Apache Spark under the hood) but failed to organize a proper flow of transformation and validation phases. That is how we came to DBT tool.
It helps us to move data transformation from AWS Glue (that is good at extract and load of data) to separate tool allowing us to do transformation (letter T in ETL) like a pro:
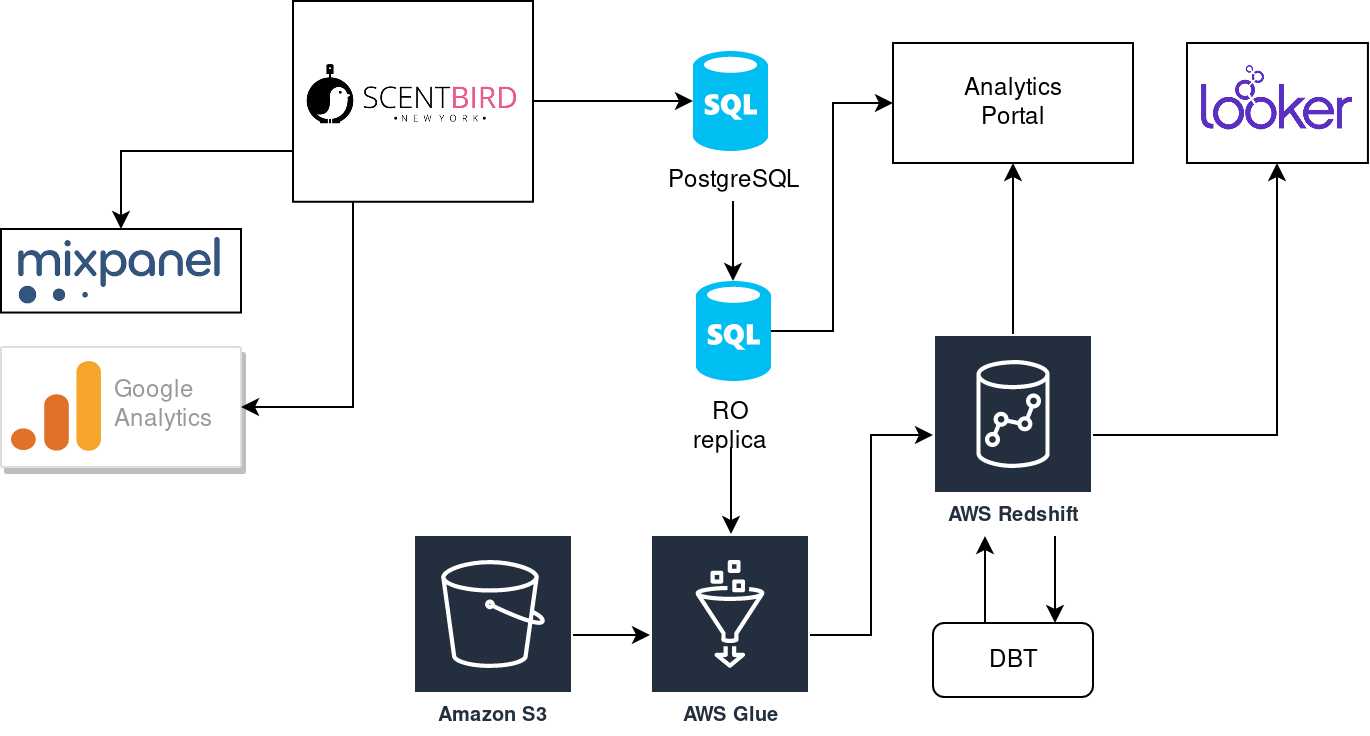
DBT tool allows us:
- store data transformation models as code, supporting version control;
- create transformation models with SQL;
- reuse our SQL code with integrated JINJA;
- simple creation of incremental data models;
- build-in data test framework.
What can you pick up to your experience from our journey?
I try to make a summary:
- Do not share the same DB instance for analytics and your main service that is producing data. At least start with separate read-only replica for analytics.
- You definitely should go for analytics-oriented DB. You can not use it from the very beginning, but keep in mind the idea that you will be at some point move to another kind of database. Once you get report complex and slow enough to make users feel uncomfortable - start your migration.
- ETL looks like an easy part of all your journey at the very beginning. Do not let you be fooled - it is important and complex part. Choose it carefully.
- You should test and control your data. Start it as soon as possible.
- Moving to 3rd party BI tool will be an expensive step. However, it will give you a lot of time to work with data, not UI. You will get a feeling that you need it. Start with some free solution (open-source or your custom solution).
